When you’re considering the direction your company is taking, the Lifetime Value (LTV) of a user is one of the most important metrics to understand. Different LTV models can inform decisions like how much you can pay to acquire a user, the effects of losing users, and how changes to a product affect the sum-total revenue you can expect to bring in from a user.
It’s also an easy metric to look at in order to see the overall health of a product in terms of both revenue and customer retention. A growing LTV means a company is doing well—customers are happy and will be giving you more money over the life of your relationship. On the other hand, a declining LTV means that a company is getting less money out of each customer it brings in and needs to fix something fast.
LTV is an especially important metric because it shows you a more complete picture than other figures. For example, ARPU only shows what you are charging, on average, for a customer in a given month. What it doesn’t show is whether or not your customers are going to keep paying that amount, for a long or short time period, or if they are likely to upgrade and pay your company more money in the future.
Similarly, retention figures don’t tell the whole story. While customer retention shows if your customers are sticking with you, it won’t show if customers are paying more or less each month. And while revenue retention will show if your customers are upgrading or downgrading—and thus giving you more or less money—it won’t show you whether your number of customers is fluctuating.
This is why LTV is so important to understand—it fills in the blank spaces between ARPU and retention, giving you a more robust picture of where you stand.
How LTV is usually calculated, and then move on to explaining how the methodology we use is different and what it’s better.
On the technical aspects of LTV calculation
One of the simplest and most frequently used models of LTV for subscription companies is based on ARPU and the company’s churn rate over a certain period of time. Due to the fact that most SaaS companies charge monthly, we’ll be using the month as our period of time. The LTV for any given month, then, is the amount that each current customer of the company is expected to pay during the remainder of their lifetime with the company.

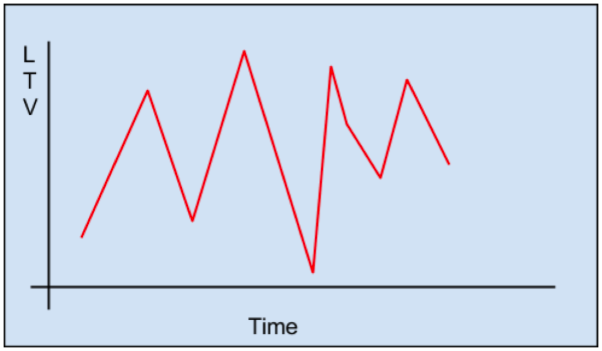
One of the biggest drawbacks of this, and all other traditional LTV calculations, is that there needs to be a large enough sample size (number of customers) in order for the LTV calculation to be meaningful. If a company has a large number of both customers and revenue, then there should be low variation in month to month changes, unless the company is either doing something very right (in which case, we’d expect these numbers to increase drastically) or very wrong (decrease drastically). The problem with having a low number of revenue (or customers) is that it reduces the statistical power of the model, meaning that the model’s expectations are less reliable. Also, with a lower number of customers, each individual customer has a greater impact on the LTV calculation for that month.
If a company with a small number of customers loses 1 or 2 customers or a few hundred dollars it will cause the LTV to spike for that month, giving a chart for LTV that looks like Figure 1.
Another potential problem is that if a company is strong enough to have 100% retention in a given month, the calculation becomes mathematically impossible, because you can’t divide by zero.
We love to geek out on data and metrics alot. Probably more than we’d normally admit in public. After a lot of pondering and discussion, we feel like we've figured it out a better way to deal with low customer numbers and retention by developing a unique algorithm (the technical term being “secret sauce”). This algorithm lets us better regulate small changes, as it looks at how LTV is trending instead. It does this by comparing this month’s LTV to last month’s in order to remove the spikiness that can be caused by small samples sizes, giving an overall more accurate LTV.
Also read: ARPU - How to calculate ???
Also, by looking at trends instead of using other methods to deal with highly variable data like lifetime capping—saying that each customer will only stay with a company for a certain number of months or years (a number that will be different for each company)—we can also better predict an LTV for all types of companies, regardless of their size, retention numbers, or growth rates. Using trends also helps deal with problems like having months with 100% or greater retention—instead of having huge unrealistic spikes, we can show a reasonable uptick in LTV, shown in Figure 2.

Figure 2. LTV calculated with the secret (in green).
It’s much easier to see the trends and growth in the LTV for the company with our algorithm, as it smoothes out some of the spikiness found in the raw data. At the same time, the up and down fluctuations are maintained. A simple trend line won’t show these peaks and valleys, which can be important for making decisions.
Overall, our model of LTV provides more actionable data, while still ensuring that the information is presented in a reasonable and accessible way, leaving you with actionable insight, not fussing over peaks and valleys. That’s why we calculate LTV as we do, and it’s our driving goal with everything we do
Comments
Post a Comment